Repository navigation
Missing java stack trace #34923
Description

Description
When an error happens in Java code, the stack trace only shows the JNI C++ code stack trace.
I assume this might be a limitation of the New Architecture, but I don't have enough knowledge about it.
Version
0.70.2
Output of npx react-native info
info Fetching system and libraries information...
System:
    OS: macOS 12.6
    CPU: (10) arm64 Apple M1 Pro
    Memory: 272.92 MB / 32.00 GB
    Shell: 5.8.1 - /bin/zsh
  Binaries:
    Node: 16.17.1 - ~/.volta/tools/image/node/16.17.1/bin/node
    Yarn: 1.22.19 - ~/.volta/tools/image/yarn/1.22.19/bin/yarn
    npm: 8.15.0 - ~/.volta/tools/image/node/16.17.1/bin/npm
    Watchman: 2022.07.04.00 - /opt/homebrew/bin/watchman
  Managers:
    CocoaPods: 1.11.3 - /opt/homebrew/lib/ruby/gems/2.7.0/bin/pod
  SDKs:
    iOS SDK:
      Platforms: DriverKit 21.4, iOS 16.0, macOS 12.3, tvOS 16.0, watchOS 9.0
    Android SDK: Not Found
  IDEs:
    Android Studio: 2021.2 AI-212.5712.43.2112.8815526
    Xcode: 14.0.1/14A400 - /usr/bin/xcodebuild
  Languages:
    Java: 11.0.16 - /usr/bin/javac
  npmPackages:
    @react-native-community/cli: Not Found
    react: 18.1.0 => 18.1.0
    react-native: 0.70.2 => 0.70.2
    react-native-macos: Not Found
  npmGlobalPackages:
    *react-native*: Not Found
Steps to reproduce
Throw an error in native Java code.
public class CalculatorModuleImpl {

    public static final String NAME = "Calculator";

    public static void add(double a, double b, Promise promise) {
        throw new RuntimeException("My custom runtime exception");
    }

}
Snack, code example, screenshot, or link to a repository
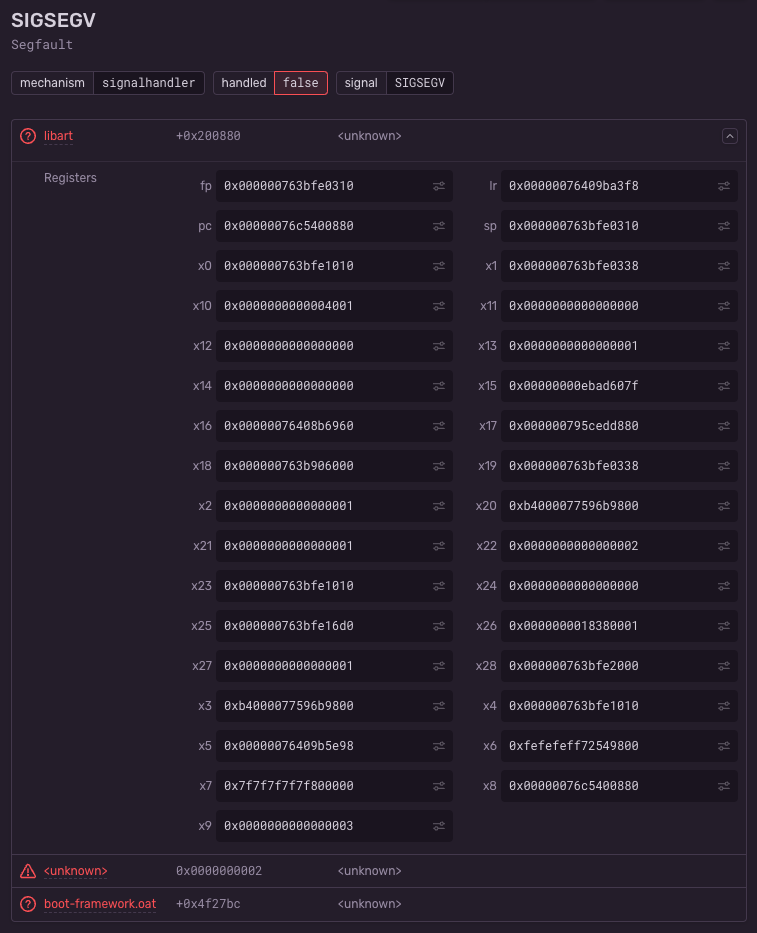
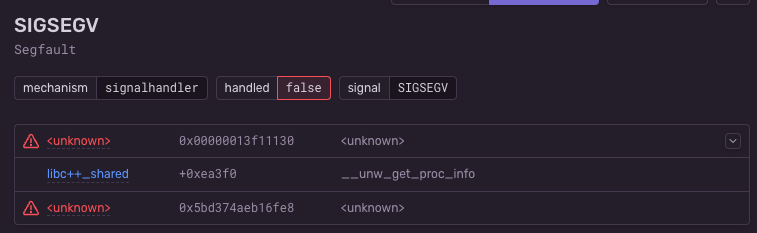
adblog
10-10 14:53:14.231 11809 11809 F DEBUG   : *** *** *** *** *** *** *** *** *** *** *** *** *** *** *** ***
10-10 14:53:14.231 11809 11809 F DEBUG   : Build fingerprint: 'google/sdk_gphone64_arm64/emu64a:13/TPB4.220624.004/8808248:userdebug/dev-keys'
10-10 14:53:14.231 11809 11809 F DEBUG   : Revision: '0'
10-10 14:53:14.231 11809 11809 F DEBUG   : ABI: 'arm64'
10-10 14:53:14.231 11809 11809 F DEBUG   : Timestamp: 2022-10-10 14:53:13.952847770+0200
10-10 14:53:14.231 11809 11809 F DEBUG   : Process uptime: 125s
10-10 14:53:14.231 11809 11809 F DEBUG   : Cmdline: com.newarchitecture
10-10 14:53:14.231 11809 11809 F DEBUG   : pid: 11634, tid: 11694, name: mqt_native_modu  >>> com.newarchitecture <<<
10-10 14:53:14.231 11809 11809 F DEBUG   : uid: 10166
10-10 14:53:14.231 11809 11809 F DEBUG   : tagged_addr_ctrl: 0000000000000001 (PR_TAGGED_ADDR_ENABLE)
10-10 14:53:14.231 11809 11809 F DEBUG   : pac_enabled_keys: 000000000000000f (PR_PAC_APIAKEY, PR_PAC_APIBKEY, PR_PAC_APDAKEY, PR_PAC_APDBKEY)
10-10 14:53:14.231 11809 11809 F DEBUG   : signal 11 (SIGSEGV), code 2 (SEGV_ACCERR), fault addr 0x0000000014da3768
10-10 14:53:14.231 11809 11809 F DEBUG   :     x0  0000007482581c90  x1  0000007482580fb8  x2  0000000000000001  x3  b4000075b4cd9bf0
10-10 14:53:14.231 11809 11809 F DEBUG   :     x4  0000007482581c90  x5  00000074af1d5e98  x6  fefefeff72549b0a  x7  7f7f7f7f7f7fff7f
10-10 14:53:14.231 11809 11809 F DEBUG   :     x8  0000000014da3768  x9  0000000000000003  x10 0000000000002dae  x11 0000000000000000
10-10 14:53:14.231 11809 11809 F DEBUG   :     x12 0000000000000000  x13 0000000000000001  x14 ffffffffffffffff  x15 00000000ebad607f
10-10 14:53:14.231 11809 11809 F DEBUG   :     x16 00000074b186c960  x17 00000077b92251c0  x18 0000007481bfa000  x19 0000007482580fb8
10-10 14:53:14.231 11809 11809 F DEBUG   :     x20 b4000075b4cd9bf0  x21 0000000000000001  x22 0000000000000002  x23 0000007482581c90
10-10 14:53:14.231 11809 11809 F DEBUG   :     x24 0000000000000000  x25 0000007482582540  x26 0000000018380001  x27 0000000000000008
10-10 14:53:14.231 11809 11809 F DEBUG   :     x28 0000007482583000  x29 0000007482580f90
10-10 14:53:14.231 11809 11809 F DEBUG   :     lr  00000074af1da3f8  sp  0000007482580f90  pc  0000000014da3768  pst 0000000000001000
10-10 14:53:14.231 11809 11809 F DEBUG   : backtrace:
10-10 14:53:14.231 11809 11809 F DEBUG   :       #00 pc 00000000021a3768  [anon:dalvik-main space (region space)]
10-10 14:53:14.231 11809 11809 F DEBUG   :       #01 pc 00000000000ea3f4  /data/app/~~QI_T36Pmi0KeDV4DsONm8A==/com.newarchitecture-QckDBT4gB4FrRRR4qujBfw==/lib/arm64/libc++_shared.so (BuildId: 98cfeb2d0d7d7a1c10770e4af2df8cf0af2c2c8c)
10-10 14:53:14.231 11809 11809 F DEBUG   :       #02 pc 00000000000e9fe4  /data/app/~~QI_T36Pmi0KeDV4DsONm8A==/com.newarchitecture-QckDBT4gB4FrRRR4qujBfw==/lib/arm64/libc++_shared.so (BuildId: 98cfeb2d0d7d7a1c10770e4af2df8cf0af2c2c8c)
10-10 14:53:14.231 11809 11809 F DEBUG   :       #03 pc 00000000000e60f0  /data/app/~~QI_T36Pmi0KeDV4DsONm8A==/com.newarchitecture-QckDBT4gB4FrRRR4qujBfw==/lib/arm64/libc++_shared.so (BuildId: 98cfeb2d0d7d7a1c10770e4af2df8cf0af2c2c8c)
10-10 14:53:14.231 11809 11809 F DEBUG   :       #04 pc 00000000000e5f78  /data/app/~~QI_T36Pmi0KeDV4DsONm8A==/com.newarchitecture-QckDBT4gB4FrRRR4qujBfw==/lib/arm64/libc++_shared.so (__gxx_personality_v0+224) (BuildId: 98cfeb2d0d7d7a1c10770e4af2df8cf0af2c2c8c)
10-10 14:53:14.231 11809 11809 F DEBUG   :       #05 pc 000000000001ed94  /data/app/~~QI_T36Pmi0KeDV4DsONm8A==/com.newarchitecture-QckDBT4gB4FrRRR4qujBfw==/lib/arm64/libfbjni.so (BuildId: 5b9237c4cf8ff477d69b3a6401b060d9b7f17a75)
10-10 14:53:14.231 11809 11809 F DEBUG   :       #06 pc 000000000001f29c  /data/app/~~QI_T36Pmi0KeDV4DsONm8A==/com.newarchitecture-QckDBT4gB4FrRRR4qujBfw==/lib/arm64/libfbjni.so (BuildId: 5b9237c4cf8ff477d69b3a6401b060d9b7f17a75)
10-10 14:53:14.231 11809 11809 F DEBUG   :       #07 pc 000000000001314c  /data/app/~~QI_T36Pmi0KeDV4DsONm8A==/com.newarchitecture-QckDBT4gB4FrRRR4qujBfw==/lib/arm64/libfbjni.so (facebook::jni::throwPendingJniExceptionAsCppException()+260) (BuildId: 5b9237c4cf8ff477d69b3a6401b060d9b7f17a75)
10-10 14:53:14.231 11809 11809 F DEBUG   :       #08 pc 00000000000adad0  /data/app/~~QI_T36Pmi0KeDV4DsONm8A==/com.newarchitecture-QckDBT4gB4FrRRR4qujBfw==/lib/arm64/libreact_nativemodule_core.so (BuildId: 0a759c4252b4c990)
10-10 14:53:14.231 11809 11809 F DEBUG   :       #09 pc 00000000000ad9cc  /data/app/~~QI_T36Pmi0KeDV4DsONm8A==/com.newarchitecture-QckDBT4gB4FrRRR4qujBfw==/lib/arm64/libreact_nativemodule_core.so (BuildId: 0a759c4252b4c990)
10-10 14:53:14.231 11809 11809 F DEBUG   :       #10 pc 00000000000ad980  /data/app/~~QI_T36Pmi0KeDV4DsONm8A==/com.newarchitecture-QckDBT4gB4FrRRR4qujBfw==/lib/arm64/libreact_nativemodule_core.so (BuildId: 0a759c4252b4c990)
10-10 14:53:14.231 11809 11809 F DEBUG   :       #11 pc 00000000000ad958  /data/app/~~QI_T36Pmi0KeDV4DsONm8A==/com.newarchitecture-QckDBT4gB4FrRRR4qujBfw==/lib/arm64/libreact_nativemodule_core.so (BuildId: 0a759c4252b4c990)
10-10 14:53:14.231 11809 11809 F DEBUG   :       #12 pc 00000000000ac674  /data/app/~~QI_T36Pmi0KeDV4DsONm8A==/com.newarchitecture-QckDBT4gB4FrRRR4qujBfw==/lib/arm64/libreact_nativemodule_core.so (BuildId: 0a759c4252b4c990)
10-10 14:53:14.231 11809 11809 F DEBUG   :       #13 pc 00000000003d0398  /data/app/~~QI_T36Pmi0KeDV4DsONm8A==/com.newarchitecture-QckDBT4gB4FrRRR4qujBfw==/lib/arm64/libhermes-executor-debug.so (BuildId: fa38c24f70f1021b)
10-10 14:53:14.231 11809 11809 F DEBUG   :       #14 pc 00000000003d0350  /data/app/~~QI_T36Pmi0KeDV4DsONm8A==/com.newarchitecture-QckDBT4gB4FrRRR4qujBfw==/lib/arm64/libhermes-executor-debug.so (std::__ndk1::function<void ()>::operator()() const+20) (BuildId: fa38c24f70f1021b)
10-10 14:53:14.231 11809 11809 F DEBUG   :       #15 pc 000000000020a374  /data/app/~~QI_T36Pmi0KeDV4DsONm8A==/com.newarchitecture-QckDBT4gB4FrRRR4qujBfw==/lib/arm64/libreactnativejni.so (BuildId: d129deaa93bd451b)
10-10 14:53:14.231 11809 11809 F DEBUG   :       #16 pc 000000000020a2f0  /data/app/~~QI_T36Pmi0KeDV4DsONm8A==/com.newarchitecture-QckDBT4gB4FrRRR4qujBfw==/lib/arm64/libreactnativejni.so (BuildId: d129deaa93bd451b)
10-10 14:53:14.231 11809 11809 F DEBUG   :       #17 pc 000000000020a2a4  /data/app/~~QI_T36Pmi0KeDV4DsONm8A==/com.newarchitecture-QckDBT4gB4FrRRR4qujBfw==/lib/arm64/libreactnativejni.so (BuildId: d129deaa93bd451b)
10-10 14:53:14.231 11809 11809 F DEBUG   :       #18 pc 000000000020a27c  /data/app/~~QI_T36Pmi0KeDV4DsONm8A==/com.newarchitecture-QckDBT4gB4FrRRR4qujBfw==/lib/arm64/libreactnativejni.so (BuildId: d129deaa93bd451b)
10-10 14:53:14.231 11809 11809 F DEBUG   :       #19 pc 0000000000209080  /data/app/~~QI_T36Pmi0KeDV4DsONm8A==/com.newarchitecture-QckDBT4gB4FrRRR4qujBfw==/lib/arm64/libreactnativejni.so (BuildId: d129deaa93bd451b)
10-10 14:53:14.231 11809 11809 F DEBUG   :       #20 pc 000000000000f80c  /data/app/~~QI_T36Pmi0KeDV4DsONm8A==/com.newarchitecture-QckDBT4gB4FrRRR4qujBfw==/lib/arm64/libfbjni.so (facebook::jni::detail::MethodWrapper<void (facebook::jni::JNativeRunnable::*)(), &(facebook::jni::JNativeRunnable::run()), facebook::jni::JNativeRunnable, void>::dispatch(facebook::jni::alias_ref<facebook::jni::detail::JTypeFor<facebook::jni::HybridClass<facebook::jni::JNativeRunnable, facebook::jni::JRunnable>::JavaPart, facebook::jni::JRunnable, void>::_javaobject*>)+32) (BuildId: 5b9237c4cf8ff477d69b3a6401b060d9b7f17a75)
10-10 14:53:14.231 11809 11809 F DEBUG   :       #21 pc 000000000000f778  /data/app/~~QI_T36Pmi0KeDV4DsONm8A==/com.newarchitecture-QckDBT4gB4FrRRR4qujBfw==/lib/arm64/libfbjni.so (facebook::jni::detail::FunctionWrapper<void (*)(facebook::jni::alias_ref<facebook::jni::detail::JTypeFor<facebook::jni::HybridClass<facebook::jni::JNativeRunnable, facebook::jni::JRunnable>::JavaPart, facebook::jni::JRunnable, void>::_javaobject*>), facebook::jni::detail::JTypeFor<facebook::jni::HybridClass<facebook::jni::JNativeRunnable, facebook::jni::JRunnable>::JavaPart, facebook::jni::JRunnable, void>::_javaobject*, void>::call(_JNIEnv*, _jobject*, void (*)(facebook::jni::alias_ref<facebook::jni::detail::JTypeFor<facebook::jni::HybridClass<facebook::jni::JNativeRunnable, facebook::jni::JRunnable>::JavaPart, facebook::jni::JRunnable, void>::_javaobject*>))+60) (BuildId: 5b9237c4cf8ff477d69b3a6401b060d9b7f17a75)
10-10 14:53:14.231 11809 11809 F DEBUG   :       #22 pc 0000000000440354  /apex/com.android.art/lib64/libart.so (art_quick_generic_jni_trampoline+148) (BuildId: 97fdb979efb7d2b596fa4fceabaad95b)
10-10 14:53:14.231 11809 11809 F DEBUG   :       #23 pc 000000000200ce78  /memfd:jit-cache (deleted) (android.os.Handler.handleCallback+152)
10-10 14:53:14.231 11809 11809 F DEBUG   :       #24 pc 0000000002007c84  /memfd:jit-cache (deleted) (android.os.Handler.dispatchMessage+116)
10-10 14:53:14.231 11809 11809 F DEBUG   :       #25 pc 000000000020a2b0  /apex/com.android.art/lib64/libart.so (nterp_helper+4016) (BuildId: 97fdb979efb7d2b596fa4fceabaad95b)
10-10 14:53:14.231 11809 11809 F DEBUG   :       #26 pc 0000000000068840  [anon:dalvik-classes2.dex extracted in memory from /data/app/~~QI_T36Pmi0KeDV4DsONm8A==/com.newarchitecture-QckDBT4gB4FrRRR4qujBfw==/base.apk!classes2.dex] (com.facebook.react.bridge.queue.MessageQueueThreadHandler.dispatchMessage+0)
10-10 14:53:14.231 11809 11809 F DEBUG   :       #27 pc 0000000002010404  /memfd:jit-cache (deleted) (android.os.Looper.loopOnce+1444)
10-10 14:53:14.231 11809 11809 F DEBUG   :       #28 pc 0000000000209a9c  /apex/com.android.art/lib64/libart.so (nterp_helper+1948) (BuildId: 97fdb979efb7d2b596fa4fceabaad95b)
10-10 14:53:14.231 11809 11809 F DEBUG   :       #29 pc 0000000000497886  /system/framework/framework.jar (android.os.Looper.loop+162)
10-10 14:53:14.231 11809 11809 F DEBUG   :       #30 pc 0000000000209334  /apex/com.android.art/lib64/libart.so (nterp_helper+52) (BuildId: 97fdb979efb7d2b596fa4fceabaad95b)
10-10 14:53:14.231 11809 11809 F DEBUG   :       #31 pc 00000000000689ce  [anon:dalvik-classes2.dex extracted in memory from /data/app/~~QI_T36Pmi0KeDV4DsONm8A==/com.newarchitecture-QckDBT4gB4FrRRR4qujBfw==/base.apk!classes2.dex] (com.facebook.react.bridge.queue.MessageQueueThreadImpl$4.run+74)
10-10 14:53:14.231 11809 11809 F DEBUG   :       #32 pc 000000000020b074  /apex/com.android.art/lib64/libart.so (nterp_helper+7540) (BuildId: 97fdb979efb7d2b596fa4fceabaad95b)
10-10 14:53:14.231 11809 11809 F DEBUG   :       #33 pc 00000000000f6748  /apex/com.android.art/javalib/core-oj.jar (java.lang.Thread.run+8)
10-10 14:53:14.231 11809 11809 F DEBUG   :       #34 pc 000000000043696c  /apex/com.android.art/lib64/libart.so (art_quick_invoke_stub+556) (BuildId: 97fdb979efb7d2b596fa4fceabaad95b)
10-10 14:53:14.231 11809 11809 F DEBUG   :       #35 pc 0000000000468738  /apex/com.android.art/lib64/libart.so (art::ArtMethod::Invoke(art::Thread*, unsigned int*, unsigned int, art::JValue*, char const*)+156) (BuildId: 97fdb979efb7d2b596fa4fceabaad95b)
10-10 14:53:14.231 11809 11809 F DEBUG   :       #36 pc 0000000000468420  /apex/com.android.art/lib64/libart.so (art::JValue art::InvokeVirtualOrInterfaceWithJValues<art::ArtMethod*>(art::ScopedObjectAccessAlreadyRunnable const&, _jobject*, art::ArtMethod*, jvalue const*)+388) (BuildId: 97fdb979efb7d2b596fa4fceabaad95b)
10-10 14:53:14.231 11809 11809 F DEBUG   :       #37 pc 0000000000617f0c  /apex/com.android.art/lib64/libart.so (art::Thread::CreateCallback(void*)+1668) (BuildId: 97fdb979efb7d2b596fa4fceabaad95b)
10-10 14:53:14.231 11809 11809 F DEBUG   :       #38 pc 00000000000b62b8  /apex/com.android.runtime/lib64/bionic/libc.so (__pthread_start(void*)+208) (BuildId: 058e3ec96fa600fb840a6a6956c6b64e)
10-10 14:53:14.231 11809 11809 F DEBUG   :       #39 pc 0000000000052fb8  /apex/com.android.runtime/lib64/bionic/libc.so (__start_thread+64) (BuildId: 058e3ec96fa600fb840a6a6956c6b64e)
10-10 14:53:14.242   347   398 W RanchuHwc: presentDisplay display has no layers to compose, flushing client target buffer.
10-10 14:53:14.243   231   231 E tombstoned: Tombstone written to: tombstone_26
Activity
marandaneto commentedon Oct 11, 2022
Apparently when you throw an exception on Java, instead of throwing it to
Thread.UncaughtExceptionHandlerit actually throws a signal handler on NDK for Android, not sure if this is the desired behavior of the new architecture or a bug.If this is the desired behavior, still there's a problem since the stack trace isn't useful, after symbolicating with debug symbols, we still don't know what's going on.
Apparently, this is caused by
throwPendingJniExceptionAsCppExceptionon the RN engine itself.cortinico commentedon Oct 14, 2022
This is a bug IMHO. As a rule of thumb, if an exception is raised at platform level (on the JVM) it should be reported there. We have the overall error experience on the New Architecture under our radar. Thanks for investigating this 🙏
Please also consider reporting this here: https://github.com/reactwg/react-native-new-architecture/ (you can request an invite via the form on the README)
krystofwoldrich commentedon Oct 17, 2022
@cortinico Thanks for the link, I've requested an invite. I'll be happy to add to the discussion.
alexkrav commentedon Jan 5, 2023
@cortinico The similar crashes (signal 11 (SIGSEGV) at
facebook::jni::throwPendingJniExceptionAsCppException()+260) were reported in otherunresolved tickets #34752 , #34684, #34700 with multiple
same problemfrom other users.Please let us know a solution or workaround to see the proper stacks .
krystofwoldrich commentedon Feb 27, 2023
Did something change in
0.71the same code now throws a correct Java exception? But what worries me is the stack trace, as it looks exactly the same as with the legacy architecture. Does it mean that the bridge is used?Here is an example of how the stack trace differed between 0.70 and 0.71.
https://github.com/krystofwoldrich/repro-java-cpp-error
github-actions commentedon Sep 26, 2023
This issue is stale because it has been open 180 days with no activity. Remove stale label or comment or this will be closed in 7 days.
krystofwoldrich commentedon Sep 26, 2023
Thank you everyone for your help, since this is working in 0.71 and newer versions. I will close this issue.