Repository navigation
multi-line axis titles unable to push margins #4299
Description

Automargin updates margin size correctly if axis title is large, due to say using a large font.
However, it does not update margin size if axis title is large due to line breaks.
fig.update_xaxes({'title_text': 'hiya', 'title_font': {'size': 100}, 'automargin': True})

fig.update_xaxes({'title_text': 'h<br>i<br>y<br>a', 'title_font': {'size': 100}, 'automargin': True})

Their data attributes:
(Scatter({
     'hoverinfo': 'x+name+text',
     'line': {'color': '#e53935'},
     'marker': {'color': '#e53935', 'line': {'color': '#e53935'}},
     'mode': 'lines',
     'name': 'a',
     'text': [1.000, 2.000, 3.000, 4.000],
     'x': array([datetime.datetime(2018, 1, 1, 0, 0),
                 datetime.datetime(2018, 1, 5, 0, 0),
                 datetime.datetime(2018, 1, 8, 0, 0),
                 datetime.datetime(2018, 1, 15, 0, 0)], dtype=object),
     'y': array([1, 2, 3, 4])
 }),)
First chart's layout attribute
Layout({
    'title': {'text': ''},
    'xaxis': {'automargin': True, 'title': {'font': {'size': 100}, 'text': 'hiya'}},
    'yaxis': {'rangemode': 'normal', 'title': {'text': 'degC'}}
})
Second chart's layout attribute
Layout({
    'title': {'text': ''},
    'xaxis': {'automargin': True, 'title': {'font': {'size': 100}, 'text': 'h<br>i<br>y<br>a'}},
    'yaxis': {'rangemode': 'normal', 'title': {'text': 'degC'}}
})
Activity
[-]Make axis auto-margin respond to new lines (<br>)[/-][+]Make axis automargin respond to new lines (<br>)[/+]etpinard commentedon Oct 24, 2019
Multi-line axis titles are in fact considered in the axis automargin computations (see example: https://codepen.io/etpinard/pen/MWWmoKV). For those interested, the logic is here:
plotly.js/src/plots/cartesian/axes.js
Lines 2718 to 2730 in 99fc02f
The problem with your graph is that the automargin push caused by your very large (multi-line) axis title is too big and simply dropped. The logic is here:
plotly.js/src/plots/plots.js
Lines 1842 to 1851 in 99fc02f
In other words, having your axis title push the margin would leave almost no room for the subplot, so we drop it.
I understand the behaviour is debatable (more info in #771 (comment)), but we decided not to change it in the
v1.xseries. We might consider improvements for upcoming major releases.laura-cbre commentedon Oct 24, 2019
Hi etpinard thanks for your reply.
In that case the multi-line maximum size is smaller than the single line maximum size as shown below:
sc.chart_fig.update_xaxes({'title_text': 'hiya', 'title_font': {'size': 230}, 'automargin': True})Automargin stops working for just 5 lines, at font size 12
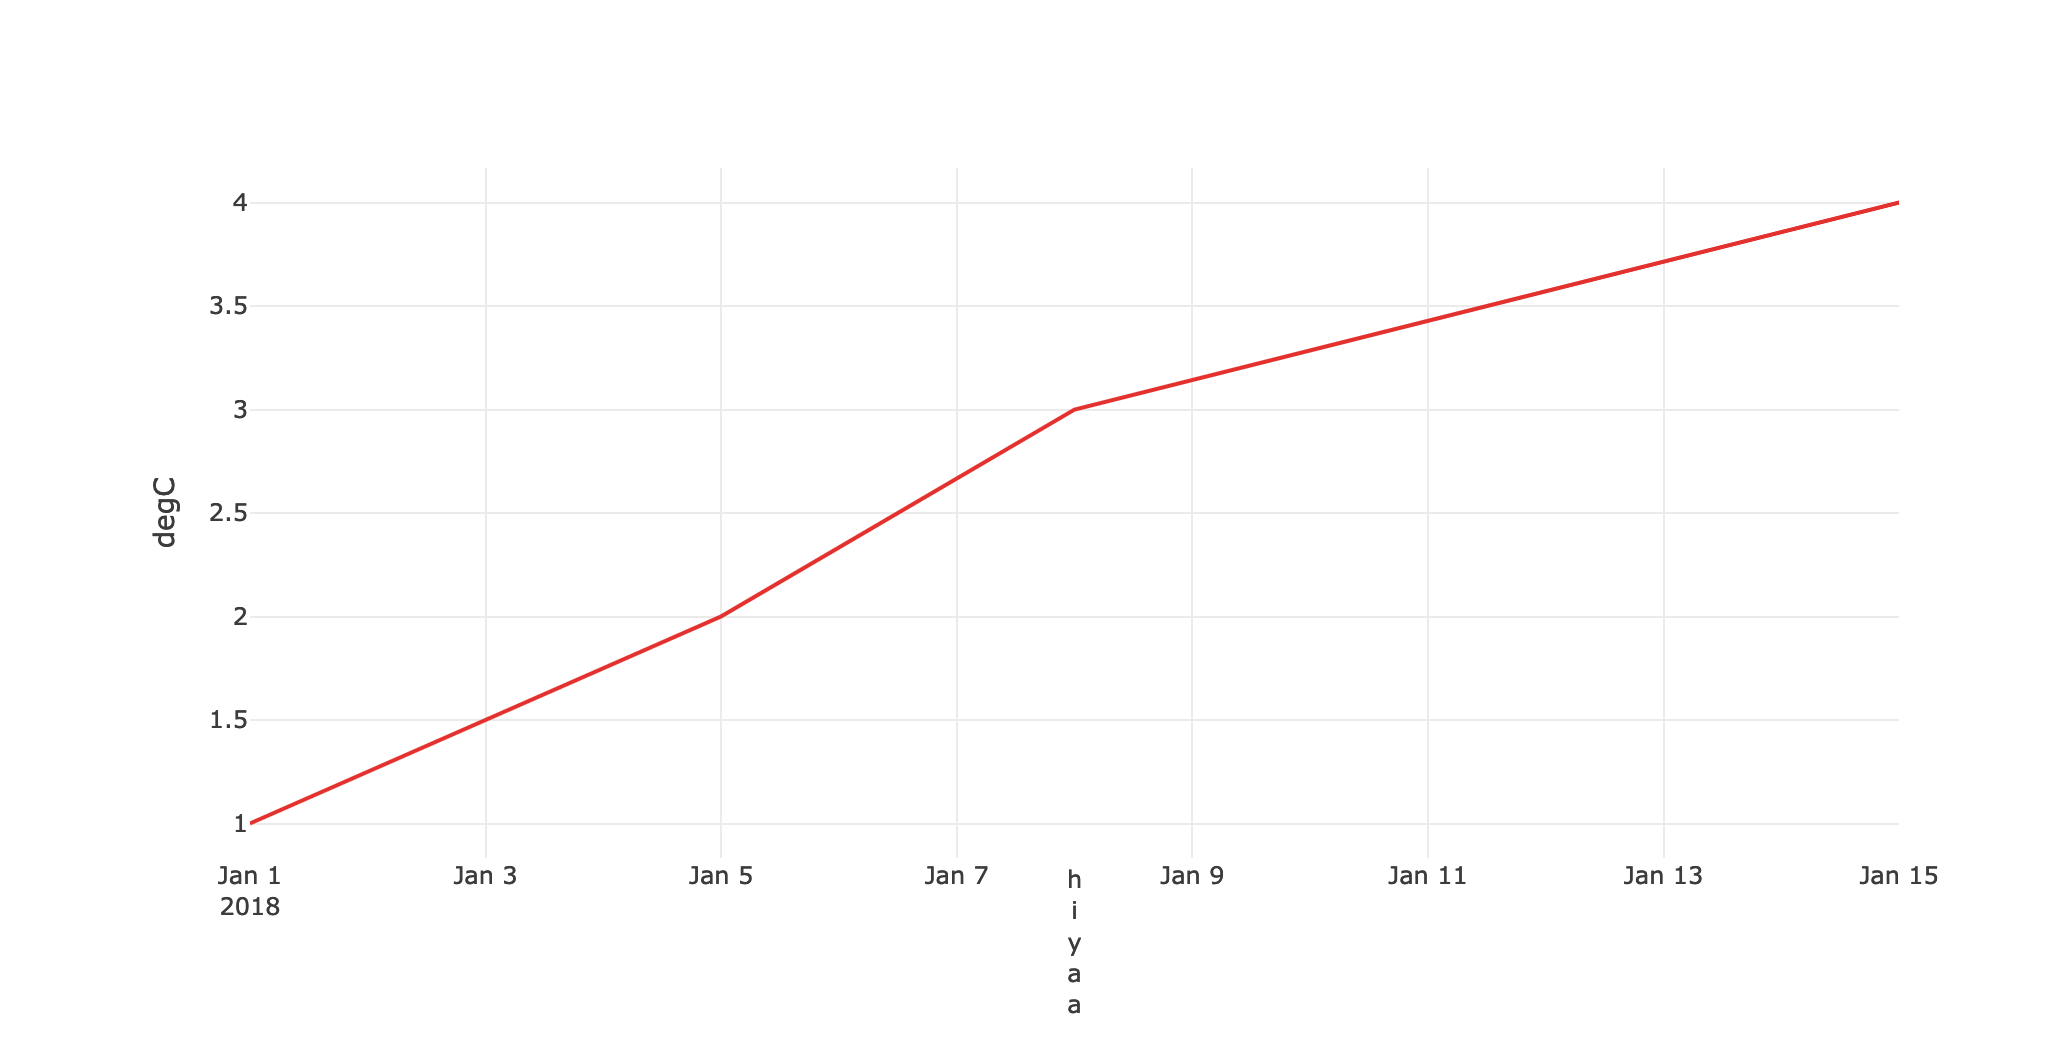
sc.chart_fig.update_xaxes({'title_text': 'h<br>i<br>y<br>a<br>a','title_font': {'size': 12}, 'automargin': True})Is there a way of asking if its a subplot, and if not, not impose a maximum size?
The reason I'm asking is there is no chart caption functionality. So I need to either use the xaxis title or annotations as a workaround for adding a chart caption. Ideally I'd be able to add up to 20 lines.
The layout objects of the above charts:
etpinard commentedon Oct 24, 2019
In general, automargin will "stop working" when the push value is greater than half of the graph's height.
I'd recommend setting the bottom margin yourself using
layout.margin.blaura-cbre commentedon Oct 24, 2019
It seems newlines impact the push value disproportionately. Unfortunately I don't know js, but is the push value ~= font size * # lines * line spacing? Could line spacing be reduced by some scalar to remedy this?
I will have many charts, each with a different number of lines, so I will have to write some hacky code to increase
layout.margin.bas some function of the number of lines. I was just hoping I could avoid this.Oh sorry by subplot you mean the actual chart, I thought you meant for cases when there are multiple subplots in the same figure.
[-]Make axis automargin respond to new lines (<br>)[/-][+]Problems encountered when setting very big axis titles[/+]archmoj commentedon Dec 3, 2020
The problem appear to be related to computing the size of multi-line text.
Here is a minimal codepen.
[-]Problems encountered when setting very big axis titles[/-][+]multi-line axis titles unable to push margins[/+]gvwilson commentedon Jun 24, 2024
Hi - we are trying to tidy up the stale issues and PRs in Plotly's public repositories so that we can focus on things that are still important to our community. Since this one has been sitting for several years, I'm going to close it; if it is still a concern, please add a comment letting us know what recent version of our software you've checked it with so that I can reopen it and add it to our backlog. Thanks for your help - @gvwilson