You signed in with another tab or window. Reload to refresh your session.You signed out in another tab or window. Reload to refresh your session.You switched accounts on another tab or window. Reload to refresh your session.Dismiss alert
I'm also looking for geom_dumbbell support if possible.
Although my own code currently throws errors for geom_segment (I suspect for non-ggploty() related reasons), perhaps this is worth trying as an alternative to geom_dumbbell as it is part of ggplot2 and not ggalt.
Just though I'd comment an update in case anyone is still following this issue.
I commented above recommending the use of geom_segment as an alternative to geom_dumbbell, however I am still running into issues.
I have the following code:
      activity_data_plot <-  ggplot() +
       geom_segment(data = activity_start_end, aes(x = start, xend = end, y = event,
                                                    yend = event, colour = event),
                     size =4, lineend = "round")+

#I have two geom_points here, to have a start and end point similar to geom_dumbbell.
#This works in ggplotly without the geom_segment lines
        geom_point(data=activity_start_end, aes(x = start, y = event), size =4, stroke = 3,shape = 21, fill = "white", colour = "black")+
        geom_point(data=activity_start_end, aes(x = end, y = event), size =4, stroke = 3, shape = 21, fill = "white", colour = "black")
I also tried using geom_rect instead of geom_segment:
       #geom_segment can be replaced with geom_rect, but throw the same error
         geom_rect(data = activity_start_end, aes(xmin = start, xmax = end, ymin = event,
                                                ymax = event, colour = event), size =4)+
When debugging, the warning message is produced here, which reads as follows:
Warning: Error in [[: attempt to select less than one element in get1index
111: eval
110: eval
109: with.default
107: FUN
106: vapply
105: FUN
104: lapply
103: gg2list
102: ggplotly.ggplot
95: func
82: origRenderFunc
81: output$activityPlot
1: runApp

Activity
cpsievert commentedon Jan 14, 2019
What package implements it?
kirbymcrae commentedon Jan 16, 2019
It's part of ggalt.
Here is the example code:
cpsievert commentedon Jan 21, 2019
Thanks, that geom seems like a fairly straightforward one, please see #1210 (comment) if you're interested in contributing a
ggplotly()hook.thomaszwagerman commentedon Jun 14, 2019
Hi all,
I'm also looking for geom_dumbbell support if possible.
Although my own code currently throws errors for geom_segment (I suspect for non-ggploty() related reasons), perhaps this is worth trying as an alternative to geom_dumbbell as it is part of ggplot2 and not ggalt.
Cheers.
thomaszwagerman commentedon Jun 17, 2019
Hi all,
Just though I'd comment an update in case anyone is still following this issue.
I commented above recommending the use of geom_segment as an alternative to geom_dumbbell, however I am still running into issues.
I have the following code:
I also tried using geom_rect instead of geom_segment:
When debugging, the warning message is produced here, which reads as follows:
This occurs after above plot is fed into:
ggplotly(activity_data_plot, dynamicTicks = TRUE, tooltip =c("y","x")) %>% layout(yaxis = list(tickmode="auto", autorange=TRUE), legend = list(orientation = "h", y=-0.2)) %>% config(displayModeBar = F)However this is not where the error seems to occur.
The dataframe looks like this:
Where I'm trying to plot a line between the start and end times of a certain event, which looks like this in ggplot:
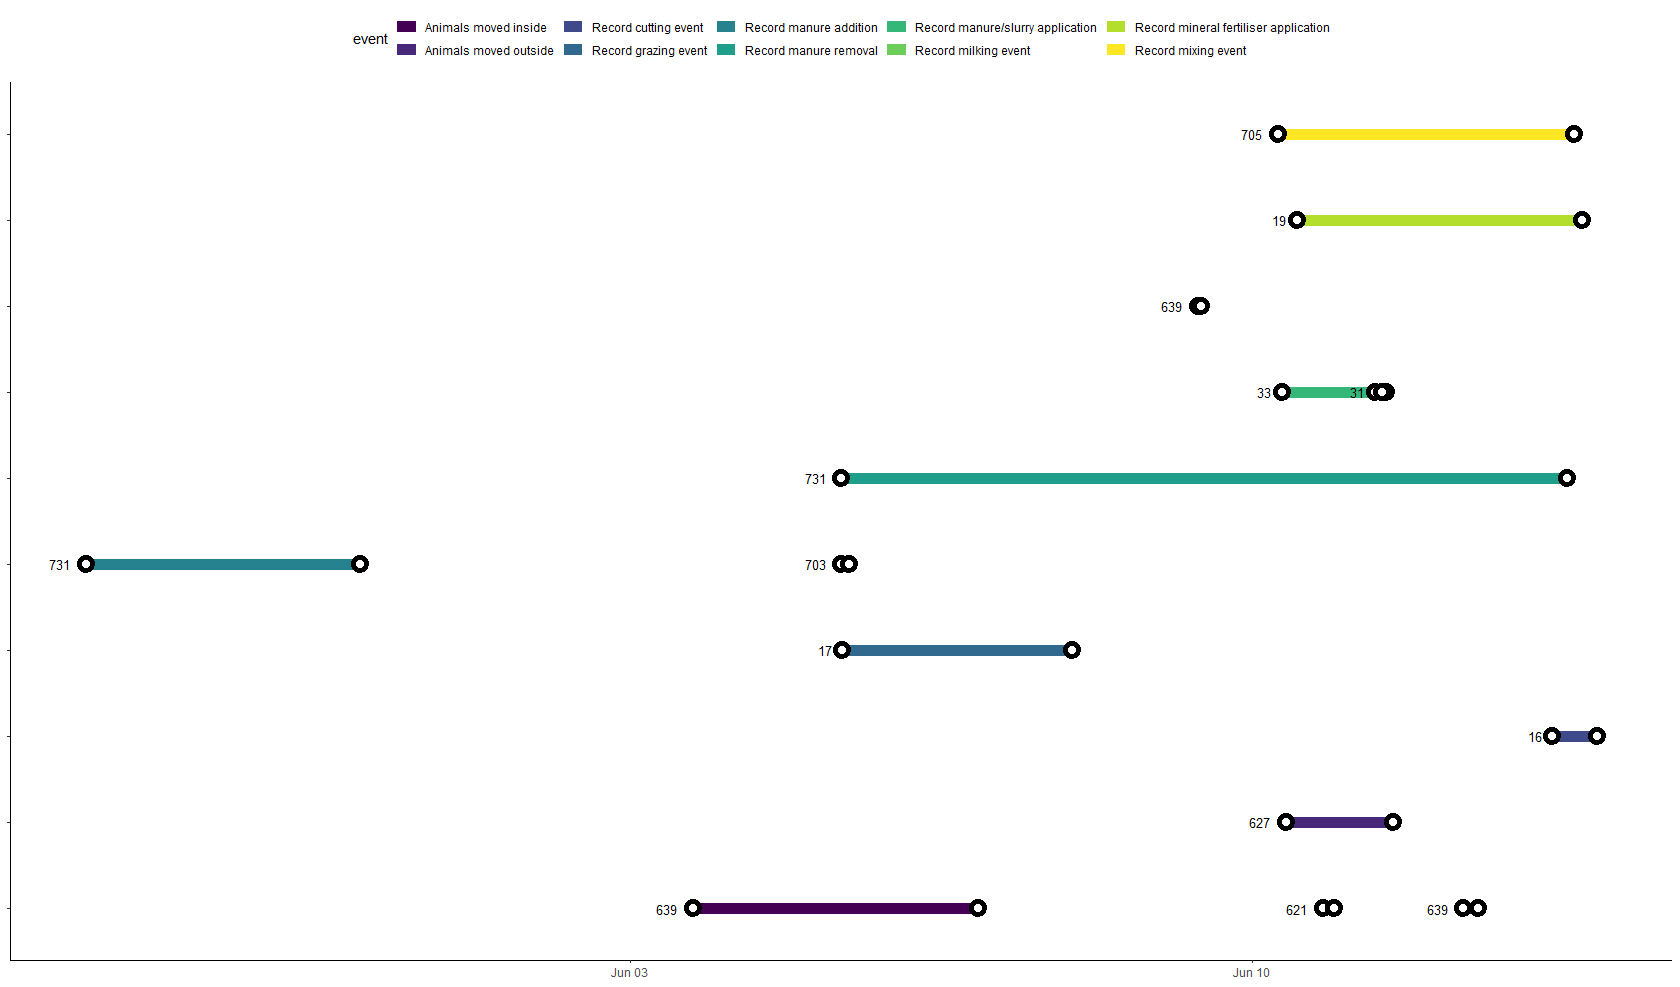
Not sure what the issue is, and would appreciate any suggestions if anyone has any.
Many thanks.
robsmith11 commentedon Mar 22, 2021
I'm getting the same error with
geom_segment: