Repository navigation
[Feature Request] Improve callback graph #1176
Description

Right now the callback graph is somewhat useful for identifying logical flow issues, but I think it could be greatly improved if it could be dynamic rather than static.
Possible improvements
- Zoom in/out functionality for large/complex callback chains
- Callback graph accessible from a dedicated url (maybe this already exists?) in addition to an overlay so that you can do test interactions while examining the callback graph
- Distinguish between clientside and serverside callbacks using different node colors.
- Report profiling information
- Number of times a callback was invoked per node
- Time spent (total or average) in the callback. Maybe link to the node color?
- Label each edge with the number of times that input triggered a callback
- Live debugging
- Highlight currently executing callbacks and modified outputs
- Probe the last input/output by hovering/focusing an edge
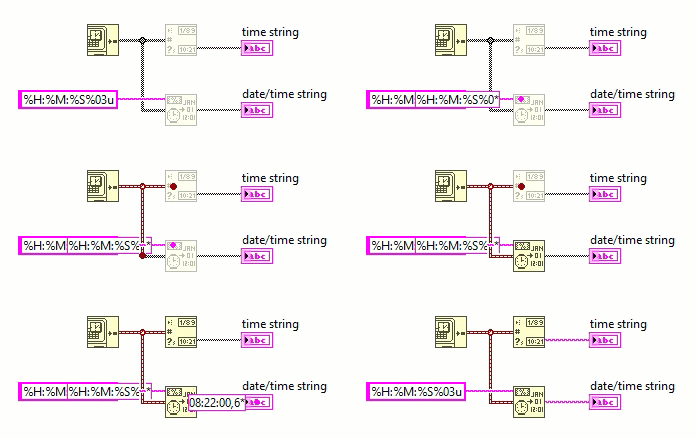
For live debugging, I'm thinking something similar to the Labview execution highlighting if you've ever used it. When you turn on debugging mode, callbacks intentionally get a delay injected into them to slow everything down so you can visually watch and inspect the logical flow. Like this:
Activity
gvwilson commentedon Jul 17, 2024
Hi - we are tidying up stale issues and PRs in Plotly's public repositories so that we can focus on things that are most important to our community. If this issue is still a concern, please add a comment letting us know what recent version of our software you've checked it with so that I can reopen it and add it to our backlog. (Please note that we will give priority to reports that include a short reproducible example.) If you'd like to submit a PR, we'd be happy to prioritize a review, and if it's a request for tech support, please post in our community forum. Thank you - @gvwilson