Repository navigation
Support of FIAsp insulin curve #388
Description

Add setting to select type of insulin
A) Novo/Humalog
B) FIAsp
If A selected use current curve calculation
If B selected use maths to match curve as described on page 12 of
http://www.ema.europa.eu/docs/en_GB/document_library/EPAR_-_Product_Information/human/004046/WC500220890.pdf
Activity
peterlynton commentedon Mar 27, 2017
I'm happy to attempt to add this (new to all of it actually) but cannot find the curve calculation in Xcode .
bashem commentedon Mar 27, 2017
There is a suggestion on Gitter to just shorten the DIA instead of touching the code.
bashem commentedon Mar 27, 2017
Class that computes is evidently called InsulinMath
peterlynton commentedon Mar 27, 2017
@bashem It's early days so happy to shorten the DIA for the moment, but it may be better to generate new code for the curve as FIAsp has a very quick initial absorption rate and is currently a bit of an unknown on high doses.
You're correct regarding InsulinMath, which is based upon Glucodyn code written by Ken Stack https://github.com/kenstack/GlucoDyn. I've messaged him on Gitter to see if he can help but otherwise we need someone who can convert 4th-order polynomials to algebra.
If we're able to generate new algebra more suited to FIAsp I foresee it initially being used / tested by end users editing the code, with the potential of adding it as a secondary option to Master as FIAsp becomes more available worldwide as @CrushingT1D suggested.
jeremybarnum commentedon Apr 3, 2017
I've spent a couple of days playing with this. While I agree with the comments that shortening the DIA is a good initial approach, the seemingly much higher insulin availability of Fiasp in the first 30 minutes does mean that a new algorithm would probably be a good idea. I'll try to synthesize what I've done and upload it - it's just the math part (not that fancy - just using LINEST() in excel to match the data in the graphs of the PK from the studies), not the code. It is clear that the current approach in Loop is a bit ugly - 3 different fourth order polynomials for DIA = 3,4,5 and then the InsulinMath does a linear interpolation of the IOB depending on the DIA input by the user. It's relatively simple to take the output IOB from those functions, manually generate a new IOB curve by taking the "treatment ratios" (AUC(t) for fiasp/AUC(t) for novolog) from the Fiasp studies, and do a new fit, which I've done. But if we're going to do this I wonder if while we're at it we should look at [https://github.com/LoopKit/LoopKit/issues/90] at the same time. @scottleibrand explains here [https://groups.google.com/forum/#!msg/openaps-dev/w_YNAmaguoc/0R00sksCU4wJ] how the oref0 approach works - I want to try that for Fiasp, using the earlier peak and generating an IOB curve using with that approach and see what treatment ratios that produces. Useful references: [http://onlinelibrary.wiley.com/doi/10.1111/dom.12803/full] [https://www.hindawi.com/journals/cmmm/2015/281589/#B18]
scottleibrand commentedon Apr 3, 2017
Heh, that is an old thread. But as surprised as I would have been at the time to learn it, we're still using that approach in OpenAPS, and rather successfully. The curves we use have peak activity at 75m for a 3h DIA, and all other DIAs are simply stretched from that. So 4h peaks at 100m, and 2h peaks at 50m. Because of that peak time, @tim2000s has been using the OpenAPS 2h-DIA curve with Fiasp, and rather successfully thus far as I understand it.
bashem commentedon Apr 19, 2017
Looking at the code in LoopKit/InsulinMath, there is no DIA for 2hrs, so the 3h model would be used
jeremybarnum commentedon Apr 21, 2017
Well here goes nothing. I tried to create new curves for both Loop and OpenAPS. The work is in enclosed spreadsheet. I tried to document everything clearly. Eager for any feedback anyone has. My conclusion is that assuming we believe that Fiasp starts hitting a lot faster, as Novo Nordisk claims and as people have reported, shortening the DIA as a way to approximate the curve shape is better than nothing (and as mentioned seems to be working fine for some). But that approach would appear to involve compromises between matching activity in the first 45 minutes versus matching the tail. And since the whole point of Fiasp is to avoid post-prandial excursions, it seems worthwhile to consider adjusted curve shapes.
Example for loop DIA = 4, all the other DIAs are in the spreadsheet.
a^4 2.58154E-10
b^3 -5.56237E-08
c^2 -8.06366E-07
d -0.004278433
intercept 0.987630373
I am doing some more work on the OpenAPS curve to see if we can get a "purer" curve that is produced from user inputs that are intuitive and testable empirically, and does a good job of matching - in line with what @scottleibrand said about the original thinking behind the OpenAPS curves. I'll post that shortly.
FiaspCurve_part1.xlsx
tim2000s commentedon Apr 21, 2017
I'd be careful on this one at the moment. I started off with DIA of two hours being very effective, and effectively almost no tail, but I've since seen some changes to my body's absorption characteristics with fiasp and until I'm sure what's going on, I'd be loathe to say that the Novo curves are 100% effective every time. By all means do the work but be wary of this factor, as I'm not sure I'm seeing the same level of front loading on the absorption.
jeremybarnum commentedon Apr 21, 2017
Thanks Tim - yeah for sure this is obviously to be treated with great caution. Mostly I wanted to establish the framework - but it needs to be validated with experience clearly. And as you point out, it's all based on the published "Treatment Ratios" showing ratio of AUC between fiasp and novolog at different points in time. If those are wrong, then my curves will be wrong. And if the starting curves are wrong before getting transformed, then the new curves will also be wrong.
I want to experiment with some parameterization to allow the user to create custom shapes based on DIA test that a person can do for themselves - essentially adding some other "dials" to drive curve shape beyond just the DIA.
peterlynton commentedon May 9, 2017
@jeremybarnum Thanks so much for the FiaspCurve excel file - I am aiming to trial it. Am I correct in editing the 4hr line to the following:
return 2.58153954561464E-10 * pow(minutes, 4) -5.56237306749063E-08 * pow(minutes, 3) -8.06365857215448E-07 * pow(minutes, 2) 0.00427843253655648 * minutes + 0.98763037314288
jeremybarnum commentedon May 9, 2017
@upsetter looks like you are missing a negative sign in the last term, so the linear term before the intercept? should be -.004278...etc.
Also a few additional things:
-please be careful as I haven't been able to test it. It's just math, trivial change, should be fine, but...
-I assume you were just asking about DIA=4 as an example. If you're going to go through the trouble, you might as well change all 3 DIAs, so that if you change your DIA to something other than 4, it produces reasonable answer.
-if you're willing to do the experiment and are changing the code anyway, I would argue for doing a personalized curve shape test. Recall that everything I did presumes that the existing Novolog curve shapes are right, and that the academic data is right. It's so easy to generate a new polynomial based on your actual experience with the insulin, and update the code accordingly, it's probably worth it...of course the experiment is a pain, and arguably you would want to do it under a few different conditions, and average the result, and you should definitely read @tim2000s blog if you haven't already, but anyway. I was working on a template to facilitate the generation of the polynomial coefficients based on an experiment, I'll try to finish that and upload it. I'm hoping we can do the experiment in my house too, I'm just waiting for the right conditions.
peterlynton commentedon May 10, 2017
Thanks Jeremy, I see the missing negative sign in the last term. I will change the three DIAs at once as suggested.
This is a trial and I will be careful. I appreciate that the curves have not been tested in the wild but I'm a willing guinea pig! I will look into a personalised curve shape test, I'm not sure what's involved yet.
jeremybarnum commentedon May 16, 2017
CustomDIA_v0.1.xlsx
Here is the custom DIA template I mentioned for the personalized curve shape test. Should be pretty self explanatory. Any views/feedback welcomed.
dm61 commentedon Jul 6, 2017
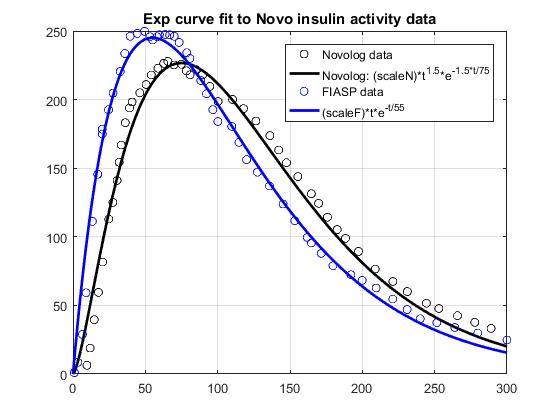
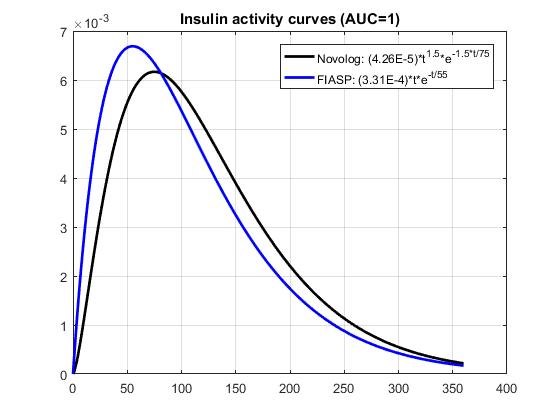
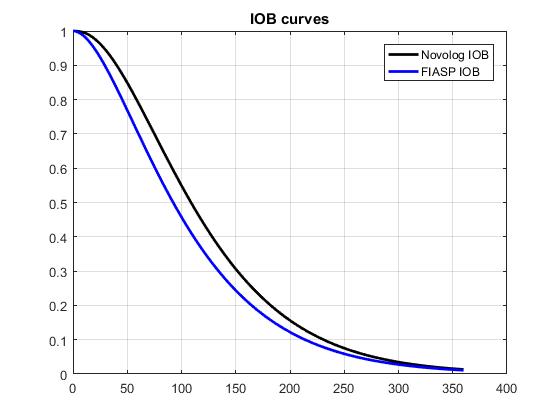
Based on Novo data shown in Figure 2 of this document, I fitted exp curves suggested by @tepidjuice. A general form of the curve is: (scale)*(t^n)exp(-nt/tau), where tau = time of peak insulin activity, and n is a parameter that may be used to adjust DIA. Taking the underlying system dynamics into account, n is expected to be 1 or 2. For Novolog, tau = 75 minutes, while n=1.5 gives a better fit to the data than 1 or 2. For FIASP, tau = 55 minutes, and n = 1. The results shown below include 1. a comparison of the data and the curve fits, 2. a comparison of insulin activity curves normalized to AUC=1, and 3. a comparison of the corresponding IOB curves.
71 remaining items
[LOOP-3375] Onboarding service integration (#388)
martinlcz commentedon May 13, 2022
Hello,
I would like to ask why pharmacokinetic curves are used to calculate IOB (Serial mean serum free insulin concentration) and pharmacodynamic curves (Serial mean serum glucose collected) are not used. I think the pharmacodynamics better describe the effect of insulin on postprandial blood glucose levels.
CosiP commentedon May 13, 2022
martinlcz commentedon May 13, 2022
I understand that pharmacokinetics describe the amount of insulin in the blood, but pharmacodynamics describes how insulin lowers blood glucose, which is of more interest to diabetics.
scottleibrand commentedon May 13, 2022
Do you have a good data source showing how the PD curve differs from the PK curve in a way that would be meaningful for IOB calculations? We used the published curves available at the time, and empirically determined that they worked well, and far better than the crude estimations we (and many insulin pumps) were using previously. There may be opportunities to improve the curve shape further, but I would need to see data indicating how the shape should differ from the exponential approximation we use today.
martinlcz commentedon May 13, 2022
There are few pharmacodynamic studies. So far, I have found that the peak depends on the size of the bolus (the larger the bolus, the later the peak). Most studies of insulin Fiasp and Lyumjev in diabetics are for 15U. In healthy people 7U, 15U and 30U. The "nichi" developer has designed a dynamic model of insulin activity, but it is quite different from the AAPS model, so I wonder if the pharmacokinetic or pharmacodynamic model is correct.
Here are some pharmacodynamic curves:
https://www.diabetesnet.com/insulins/lyumjev-a-new-fast-acting-insulin/
https://www.ema.europa.eu/en/documents/product-information/lyumjev-previously-liumjev-epar-product-information_en.pdf
https://www.researchgate.net/publication/336908971_Fast-Acting_Insulin_Aspart_A_Review_of_its_Pharmacokinetic_and_Pharmacodynamic_Properties_and_the_Clinical_Consequences
nichi - Lyumjev
val a0 = 61.33
val a1 = 12.27
val b1 = 0.05185
tp = (a0 + a1 * 2 * bolus.amount)/(1 + b1 * 2 * bolus.amount) - Lyumjev 200U
tp = (a0 + a1 * bolus.amount) / (1 + b1 * bolus.amount) - Lyumjev 200U
result.activityContrib = (2 * bolus.amount / tp_model) * t * exp(-t.pow(2.0) / tp_model)`
val lowerLimit = t
val upperLimit = 8.0 * 60
result.iobContrib = bolus.amount * (exp(-lowerLimit.pow(2.0)/tp_model) - exp(-upperLimit.pow(2.0)/tp_model))
My version - Lyumjev
val a0 = 50
val a1 = 6
val b1 = 0.06
tp = (a0 + a1 * 2 * bolus.amount)/(1 + b1 * 2 * bolus.amount) - Lyumjev 200U
tp = (a0 + a1 * bolus.amount) / (1 + b1 * bolus.amount) - Lyumjev 200U
result.activityContrib = (1.86 * bolus.amount / tp_model) * t.pow(0.86)* exp(-t.pow(1.86) / tp_model)`
val lowerLimit = t
val upperLimit = 8.0 * 60
result.iobContrib = bolus.amount * (exp(-lowerLimit.pow(1.86)/tp_model) - exp(-upperLimit.pow(1.86)/tp_model))
martinlcz commentedon May 17, 2022
Here is a comparison for different bolus sizes.


BLUE - AAPS oref peak 45 min, DIA 7h
GREEN - AAPS oref peak 60 min, DIA 7h
PURPLE - dynamic model from nichi
RED - dynamic model of my modification
AI 7U, AI 15U, AI 30U - PD models AI (healthy person)
AI 15U dia - PD model AI (DM1)
Hazelstar commentedon Feb 20, 2023
Thanks for sharing this interesting research @martinlcz , I've found myself many times "intuitively" lowering my bolus past a certain large amount of carbs (I rarely bolus more than 6UI / meal in my everyday) because even though my carb ratio is fine tuned, for a big meal with 50/50 high IG and low IG carbs, I would most certainly fall in hypo 3 or 4 hours after the meal+injection, and it's independent of whether I do an extended bolus or not.
I thought I was crazy and wondering if there was any possibility that my carb ratio was nicely tuned for a certain range (say until ~70gr of carbs), and that the more I would eat carbs, the higher it would gradually switch. But I felt it had to do with the insulin activity rather than the CR.
(For the context: I was undergoing traditional pump therapy until recently and switched to a closed loop 3weeks ago, the algorithm is a huge help when dealing with those big meals.)
ijustlovemath commentedon Dec 19, 2023
Hi! Sorry to revive this thread, but I'm implementing IOB in my own loop and was curious about something:
Why does treatment.insulin reflect the total insulin dose given, and not a curve (eg some step function)? Ideally you would convolve the infusion curve (in U/min) with the impulse response (these exponential curves) to get the overall system response, but it seems like all insulin treatments are assumed to be given instantaneously at a moment in time.
Of course, you could take the total dose from an infusion curve and use that as your treatment.insulin, but that seems like it would work less well when your infusion is given over a longer period of time (more than 5 minutes or so).
Anyone have thoughts on this?
ps2 commentedon Dec 19, 2023
@ijustlovemath Yes, Loop's models are not physiologically accurate in this respect, and you may improve the very short term modeling of glucose a small amount by considering an infusion curve, but since Loop is mostly looking out several hours for dosing calculations, this will have a very small effect on dosing.
ijustlovemath commentedon Dec 19, 2023
Am I correct in thinking you simply integrate your infusion curves to get the "treatment.insulin" amount?
tepidjuice commentedon Dec 19, 2023
Alenasot commentedon Dec 22, 2023
hello! the question's off subject, but may be someone know how to convert 1 U of insulin to mU/min
Sargius commentedon Aug 28, 2024
Hello! This link is broken. Could you kindly send somehow a working link or article itself. I am trying to understand underlying maths and can't find appropriate articles. Maybe this article can help!
Thanks :)
Add Glooko integration: Fiasp IOB model, insulin context in run analysis